I must warn you:
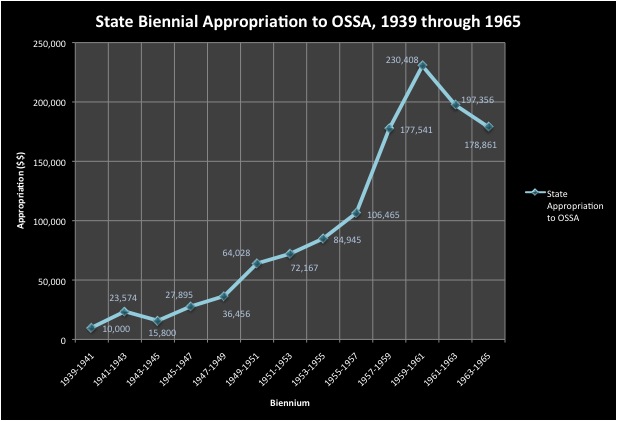
This is a graphic post. Below the fold you will see images of line graphs and bar charts that provide visual representations of data across time. They look something like this:
 |
| Image 1: Oregon State Biennial Appropriation to the OSSA, 1939 through 1965. |
If this seems like something that might cause your stomach to turn, perhaps you dare read no further; if, on the other hand, you have courage, stamina, and are sure that the kids won't be peeking over your shoulder, please do read on, because I'm seeking your input.
I would like any and all readers to weigh-in with comments and questions about the graphs below, and the conclusions I'm drawing from them, and to let me know if both of these are clear (or not). For those readers who have specialized training or experience in history, statistics, social science, mathematics, etc., I have some specific questions below that I would like help answering.
A common refrain I come across in both primary and secondary sources discussing the efforts and results of the Oregon State Sanitary Authority (OSSA) in addressing water pollution is that the Authority was not funded adequately. Authority members and historians have concluded that this lack of funding handicapped the OSSA between the time it commenced its work in early 1939 and the time that Governor Tom McCall restructured it and the Oregon Air Pollution Authority into the Oregon Department of Environmental Quality in 1969.
Perhaps the OSSA was underfunded, but that brings up at least two important points. First, it seems that the majority of government agencies, non-profits, for-profits, and individual households would prefer more money; I know I certainly would, and I also would prefer it if all of the non-profits that I support had much more funding. Therefore, it is quite common to hear complaints about a lack of money . . . but does that make it a pointless refrain, a case of "crying wolf?"
Second, is there some kind of objective reference point that one can call upon to gauge whether or not a given entity is "underfunded," "adequately funded," or "over-funded?" Maybe there are such metrics in some instances, but what might these be? In the case of the OSSA specifically, I suppose this metric would be whether or not the Authority was achieving it's legal mandate: Was the OSSA making substantive progress in abating water pollution? If not, to what extent does lack of progress correlate with a shortage of funds?
Asking these kinds of questions is important in a democracy. It's important for taxpayers to know where their money is going, and if the agency is using the money as effectively as possible. When voters turn-out overwhelmingly in favor of the creation of a new government agency -- as was the case with the OSSA in 1938 -- it's important for citizens to know that the agency is doing the work that they authorized it to do. Of course, there is at least one important dynamic that confounds this straightforward logic:
Are citizens willing to pay for achieving the purported goal of a given piece of legislation or citizen's initiative?
The pattern of my pursuit of these answers regarding the OSSA can just as easily be applied to other local, state, or federal government agencies.
The first graph I want to show you is straightforward: