 |
| Image 1: Oregon State Biennial Appropriation to the OSSA, 1939 through 1965. |
If this seems like something that might cause your stomach to turn, perhaps you dare read no further; if, on the other hand, you have courage, stamina, and are sure that the kids won't be peeking over your shoulder, please do read on, because I'm seeking your input.
I would like any and all readers to weigh-in with comments and questions about the graphs below, and the conclusions I'm drawing from them, and to let me know if both of these are clear (or not). For those readers who have specialized training or experience in history, statistics, social science, mathematics, etc., I have some specific questions below that I would like help answering.
A common refrain I come across in both primary and secondary sources discussing the efforts and results of the Oregon State Sanitary Authority (OSSA) in addressing water pollution is that the Authority was not funded adequately. Authority members and historians have concluded that this lack of funding handicapped the OSSA between the time it commenced its work in early 1939 and the time that Governor Tom McCall restructured it and the Oregon Air Pollution Authority into the Oregon Department of Environmental Quality in 1969.
Perhaps the OSSA was underfunded, but that brings up at least two important points. First, it seems that the majority of government agencies, non-profits, for-profits, and individual households would prefer more money; I know I certainly would, and I also would prefer it if all of the non-profits that I support had much more funding. Therefore, it is quite common to hear complaints about a lack of money . . . but does that make it a pointless refrain, a case of "crying wolf?"
Second, is there some kind of objective reference point that one can call upon to gauge whether or not a given entity is "underfunded," "adequately funded," or "over-funded?" Maybe there are such metrics in some instances, but what might these be? In the case of the OSSA specifically, I suppose this metric would be whether or not the Authority was achieving it's legal mandate: Was the OSSA making substantive progress in abating water pollution? If not, to what extent does lack of progress correlate with a shortage of funds?
Asking these kinds of questions is important in a democracy. It's important for taxpayers to know where their money is going, and if the agency is using the money as effectively as possible. When voters turn-out overwhelmingly in favor of the creation of a new government agency -- as was the case with the OSSA in 1938 -- it's important for citizens to know that the agency is doing the work that they authorized it to do. Of course, there is at least one important dynamic that confounds this straightforward logic: Are citizens willing to pay for achieving the purported goal of a given piece of legislation or citizen's initiative?
The pattern of my pursuit of these answers regarding the OSSA can just as easily be applied to other local, state, or federal government agencies.
The first graph I want to show you is straightforward:
|
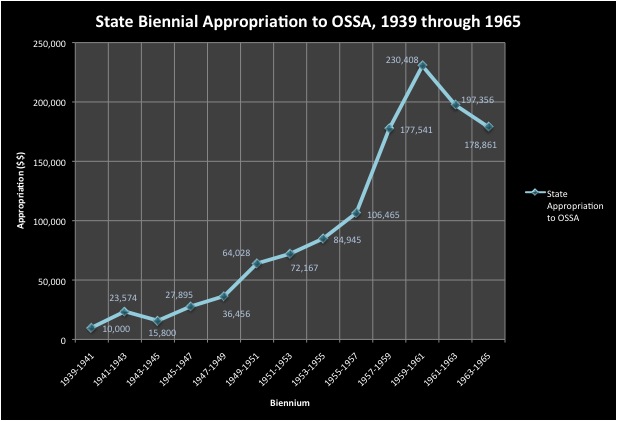
| Image 1: Oregon State Biennial Appropriation to the OSSA, 1939 through 1965. |
As you can see, the trend of Oregon State Legislature appropriations from the general fund to the OSSA between 1939 and 1965 is steadily upward, until the 1961-1963 biennium. This graph shows gross dollar amounts, not adjusted for inflation.
One thing to note in the Image 1 data is that they do not include funds indirectly used by the OSSA. For example, a portion of the State Sanitary Engineer's salary was funded by the State Board of Health, and, particularly during the OSSA's early years, the Board of Health also provided laboratory services and some technicians. Even considering this caveat, my stance is that looking at OSSA-specific appropriations over time will provide some context to help determine the extent to which the OSSA was under-funded (or not).
One might wonder how the graph above compares to the larger pool of funds from which most OSSA money came from, the state general fund. The graph below shows state general funds compared to the OSSA portion of the general fund (plus the amount the OSSA received from the federal government, when applicable):
 |
| Image 2: Oregon State General Appropriations Compared to Biennial OSSA Funds from both the State General Fund and the Federal Government, 1939 through 1965. |
This may mean that during this period state leaders didn't consider the work of the OSSA important. However, I haven't done any detailed comparison of OSSA funding with other state agencies to see how the Authority compares. Maybe I would find that many agencies are given a small fraction of overall state funding? Maybe I would find that some agencies are given preference when it comes to budget allocations? I'm not sure, but if anyone out there has a thought or suggestion, feel free to provide it below.
Comparing Image 1 with Image 2, one can see that both the state general fund and the biennial OSSA appropriations increased fairly steeply until the 1961-1963 biennium. This is interesting, but it doesn't seem to tell us much. Observing these increases in gross dollar amounts brings up two questions: 1) What were the percent increases in biennial state general fund and OSSA appropriations; 2) what percentage of the state general fund was allocated to the OSSA per biennium, and how might this have changed over time?
Image 3 addresses the second question:
 |
| Image 3. OSSA Funds as Percent of Biennial State General Fund Appropriation, 1939 through 1965. |
One way to look at Image 3 is that it supports what we see in Image 2: OSSA funding was a small percent of the state general fund during these years, ranging from .041% to .113%. However, Image 3 also tells us at least two noteworthy things.
One is that the most aberrant data point is during the 1941-1943 biennium. During this period, the OSSA's budget as a percent of the state general fund peaked at .113%, when the OSSA received $23,574 out of the overall $20,901,713 general fund. This was in the midst of World War II, but the Oregon Legislature had set the budget in mid-1941, before the U.S.A. became directly involved in the war. The 1941-1943 biennial state general fund appropriation of $20,901,713 was about $400,000 less than the 1939-1941 appropriation ($21,290,778), but about $3,000,000 less than the 1943-1945 biennial appropriation ($24,164,706). What this seems to mean, if I'm interpreting things correctly, is that both the OSSA appropriation for the 1941-1943 biennium and the overall state general fund appropriation for this biennium were outliers.
A second observation is that OSSA funding hovered in the .040-.050% range during most of this period. The percentage increased for the period 1957-1961, only to fall back, more or less, to the .040-.050% range by 1963-1965.
Image 4 speaks to the question: What were the percent increases in biennial state general fund and OSSA appropriations?
 |
| Image 4. Percent Biennial Changes in State General Fund Appropriations and OSSA-specific Appropriations, 1939 through 1965. |
Image 4 shows that legislators modified the state's and the OSSA's biennial budgets by more-or-less equal rates between 1941 and 1957 (with 1943-1945 being a notable outlier). During the 1957-1959 biennium, legislators provided an appreciably higher percent increase in the OSSA budget than they did for the state general fund, but then followed this up four years later with an appreciable decrease relative to the general fund.
The reason I wanted to compare the two data sets in Image 4 was because I was wondering if the relative level of importance that legislators gave to the issue of water pollution might be seen. For example, if legislators increased the OSSA's budget at a higher rate than they increased the overall general fund, maybe this would indicate that they perceived the issue as becoming more important? I don't draw any such unambiguous conclusions from Image 4, however.
Maybe things would be clearer if we compared (1) the biennial amounts that the OSSA requested with (2) the amounts that Oregon governors asked legislators to provide, and both of these with (3) the amount that legislators actually appropriated?
 |
| Image 5. Biennial Budget Requests from the OSSA and Oregon Governors Compared to Legislative Appropriations, 1939 through 1965. |
Image 5 shows that the OSSA did not get anything near the amount of funding that it sought during the governorships of Charles H. Martin (D, 1935-1938), Charles A. Sprague (R, 1939-1942), or Earl Snell (R, 1943-1947).[1] However, in his 1947 budget, Snell did request most of what the OSSA asked for. For the period 1939 through 1947, state legislative appropriations did not consistently track with governor requests.
Snell died in an airplane crash in October 1947, and his successor, John H. Hall (R, 1947-1949) requested the same amount that the OSSA asked for ($65,045). This initiated a period during which the OSSA's request and the budgets of governors Douglas McKay (R, 1949-1952), Paul Patterson (R, 1952-1956), and Elmo Smith (R, 1956-1957) correlated almost exactly, and state legislative appropriations tracked closely as well.
Beginning with the 1957-1959 biennium, OSSA fund requests increase sharply. Governors Robert D. Holmes (D, 1957-1959) and Mark O. Hatfield (R, 1959-1967) both agreed with OSSA funding requests. From 1957 to 1961, state legislators appropriated more money to the OSSA than either the Authority or the governor had asked for; however, from 1961 to 1965, legislators appropriated significantly less than the amounts asked for.
Here is one possible interpretation of Image 5 . . .
The first ten years or so of the OSSA can be classified as a period during which Authority members, Oregon governors, and Oregon legislators were not in agreement about the importance of water quality. The distractions of the Great Depression and World War II certainly must be factors. Also during the war, Portland city commissioners strongly resisted the efforts of the OSSA and other abatement advocates to levy the full amount of water service charges to Portland citizens so as to generate funds to build a sewage treatment facility after the war; this shows that a fourth important constituency in Oregon's water pollution abatement history also did not agree with the OSSA.
The next period begins in the late 1940s, when the priorities of the OSSA, governors, and legislators aligned -- at least in terms of legislative appropriations. There are at least three likely causes for this change. First would be the end of the distraction of World War II. Second would be the OSSA's success in forcing the City of Portland to fund (beginning in 1944) and build (beginning in 1947) the Columbia Boulevard Wastewater Treatment Facility and interceptor sewers. Third would be he passage of the 1948 Federal Water Pollution Control Act. Though it was weak in terms of enforcement, the Act was the first nationwide water quality legislation and offered federal research assistance and some funds.
The third period begins with the 1961-1963 biennial budget. The OSSA and Oregon governors (in this instance Mark Hatfield) were in agreement, but the legislature notably was not. This downturn in OSSA funding surprises me, because it occurred during a period in which one might assume the opposite would be the case.
In the early 1960s, American society was becoming more interested in environmental concerns, federal involvement in water quality issues had significantly expanded, and the OSSA had won another contentious debate with Portland city officials. Both Rachel Carson's influential book Silent Spring and Tom McCall's influential television documentary Pollution in Paradise appeared in 1962 (June/September and November, respectively). Congress had significantly strengthened the Water Pollution Control Act in 1956 and 1961, and in the late 1950s the U.S. Public Health Service had begun a twice-yearly regional conference on water quality issues. OSSA officials threatened Portland leaders with a lawsuit in 1959 if they did not provide secondary sewage treatment and expand their sewer system -- and in 1961 city officials complied rather than go to court. Also, in 1961 state legislators strengthened the 1938 law creating the OSSA and merged the OSSA with the Oregon Air Pollution Authority. In the midst of all of these developments, Oregon legislators significantly cut the OSSA's budget.
Not having data beyond 1965 frustrates my attempt to understand this decrease in funds.
I had another question about OSSA appropriations: How did the percent change in biennial appropriations compare to the rates of inflation over these years? I was thinking that if the OSSA's biennial budgets increased only incrementally, but not ahead of the rate of inflation, then the Authority's budget, in real dollars, would actually decrease. Image 6 shows us that, in spite of some significant fluctuations, the trend of the OSSA's budget was well ahead of the rate of inflation:
 |
| Image 6. Biennial Percent Changes in OSSA Funding Relative to Inflation Rates, 1939 through 1965. (Inflation rates calculated at http://www.dollartimes.com/calculators/inflation.htm.) |
A final graph I will show compares the amount of OSSA funds that the state appropriated and that the federal government provided:
 |
| Image 7. State and Federal Funds to the OSSA, 1939 through 1965. |
Image 7 offers another way to look at Image 1, and also provides data to supplement Image 2.
This graph shows the fact that prior to the 1948 Federal Water Pollution Control Act (PL 845), the OSSA received zero federal funds. From the 1949-1951 biennium through the 1955-1957 biennium, the OSSA itself received relatively little federal funding; however, during these years the OSSA did serve as the administrator of hundreds of thousands of federal dollars annually, which the Authority disbursed to various Oregon communities for the construction of sewage infrastructure. The 1956 amendments to PL 845 resulted in the OSSA receiving a much larger percentage of its annual operating budget from the federal government (by way of the U.S. Public Health Service).
Where do I go from here?
In the coming weeks, I hope to locate the data that will enable me to track OSSA/DEQ funding beyond the 1963-1965 biennium to the present. I'm particularly curious to find out precisely how much these budget numbers changed during Tom McCall's tenure as governor (1967-1975), because McCall championed water and air quality and created the DEQ while in office. Will we see a distinct difference in budget amounts for the OSSA/DEQ during and beyond McCall's time as governor?
I also am trying to track-down some information about the profits of the pulp and paper industry during these decades relative to the amount that the industry spent on it's research arm, the National Council for Stream Improvement. Considering that the State of Oregon, at least from 1939 through 1965, spent somewhere in the range of .040-.050% of its budget on the administration of its water quality agency, I think it would be interesting to compare this with the amount that the industry spent on water pollution abatement research. In the 1940s and 1950s industry representatives made much (in the press and at OSSA meetings) about the money they were spending on this research, but did their spending priorities reflect substantive efforts?
I am also very open to suggestions from readers regarding different ways I might compare or represent this data to make useful patterns more apparent. Are there any other kinds of data that I should incorporate? Using the data above, are there other important questions that I can pose and answer in some way? Do my interpretations seem plausible and my uses of data seem appropriate?
----
[1] Governor Martin requested zero dollars for the OSSA in his Jan. 1, 1939 - Dec. 31, 1940 biennial budget he submitted to state legislators. The OSSA had been created by the passage of a citizen's initiative in the November 1938 election, and it appears that Governor Martin had submitted his budget proposal to the legislature a few weeks earlier, before the Authority existed (See "Budgets for Biennium Filed with Director," Oregonian, Oct. 9, 1938, sec. 2, p. 3). The citizen's initiative did not include an appropriation.
--
Two updates:
ReplyDeleteFirst, I'm still trying to track-down data for the OSSA/DEQ budgets from the mid-1960s to the present.
Second, my friend Seth took a gander at these images a few days ago and provided some valuable insight. He suggested that I compare the amount that the OSSA budget grew per biennium (Image 1) with some kind of data that evaluated Willamette River water quality during these years. This seems like a great way to try to answer the questions I pose in para. 6: "is there some kind of objective reference point that one can call upon to gauge whether or not a given entity is "underfunded," "adequately funded," or "over-funded?" For example, if the comparative graph shows that certain key measures of water quality improved during these years, then one might assert that the funding was adequate. Keep posted.
Often, maybe even usually, when an agency or a non-profit is under funded it's for one of two reasons: (1)There is/was not a strong personality pushing for the funding, and/or (2) There is/was a strong personality pushing against adequate funding. Politics were probably involved in this instance. Very likely there was a "squeaky wheel" somewhere in the system. Can you prove your points without knowing the political (human)history behind the questions you've posed here?
ReplyDelete@ Grace: Great questions!
ReplyDeleteAs you might imagine, my blog posts on the Willamette River project tend to be snippets and snapshots wherein I'm attempting to process a certain chunk of evidence I've uncovered. The point you raise about the importance of a prominent person(s) pushing either for or against pollution abatement is critical. I actually have a clear idea of who was pushing for and against the City of Portland sewer project in the 1940s, but in the case of the OSSA the contending parties are not quite as clear.
One of the things that the data above has helped me realize is the intriguing periodization I came up with in my analysis of Image 5. The clear changes in biennial OSSA funding requests, governor's budget requests, and actual legislative appropriations points directly to the action (or inaction) of specific governors and legislative bodies. So, I can be that clear: I can say that the OSSA wanted X amount of funding each biennium, and that finally, under Governor Hall's 1947-1949 budget request, the state executive agreed with the OSSA's request (etc.).
What all of this analysis also lets me do is to provide more -- and more substantive -- context for the important role that Governor McCall played beginning in 1967.
So, to sum-up: I already had much of the political history documented, but the economic data helped bring politics into sharper focus and provided me another vector to strengthen the analysis.
Three more updates:
ReplyDeleteFirst, I'm still trying to figure out a way to correlate OSSA funding directly with water quality measurements. This comparison would also have to incorporate sewer system funding and completion dates for municipalities and districts within the watershed. I'm not sure how much of this kind of work I'll be able to complete prior to finishing the manuscript, because finding and crunching these numbers takes much of my limited time.
Second, a few weeks ago now, another friend suggested another way I could contextualize this data: compare it to the funding of some other state agencies. Finding and crunching this data may be feasible given my limited time.
Third, I have found some partially-comparable data showing funds that the pulp and paper industry allocated to its National Council for Stream Improvement (NCSI) in the 1940s. Though not without sufficient qualification, I'll be able to compare OSSA and NCSI funding during this decade as an important part of the concerted push to abate pulp and paper mill pollution beginning ca. 1949.
Hello, Mr. Hillegas. My name is Pablo Martos, and I'm currently an OSU Ecampus student pursuing a graduate certificate in Fisheries Management and residing in Portland. I'm trying to figure out where I can find "Pollution in Paradise" to watch it, since it was referenced in multiple of my class readings, and seems really worth watching. I can't seem to find it in OSU's Media Manager, just the 1940's Willamette River Pollution Film. Think you might have a link to an active digital copy somewhere?
ReplyDeleteHi Tuffy, & thanks for the hail.
ReplyDeleteUnfortunately, I do not know of any online digital versions of PiP. I would be great if there were such an online resource, like there is for Smith's 1940 footage.
Fortunately, I do know that the Multnomah County Library has it -- that's how I got watched it for the first time a few years ago. I did just run a search on Summit and see that Linn Benton C.C. has a copy that circulates. So, it seems like you can get it from the Multnomah County Library via ILLIAD or from LBCC via Summit.
Or, since you're an OSU student, you could solicit the expertise of OSU Archivist Larry Landis (http://osulibrary.oregonstate.edu/staff/landisl). He's great!
Best of luck!